
Daily Rundown delivers a holistic, consolidated, and personalized view of key performance indicators (KPIs). By organizing top-level indicators across multiple domains, it empowers users to gain a clear and actionable understanding of their workspace.
300
Happy Users
21
Reports Consolidated
5+ hours
Saved daily per user

Merchants are the buyers for Sam’s Club, their responsibilities include; selecting the item assortment sold in clubs, negotiating deals with suppliers and managing inventory. They use multiple different tools on a daily basis to review data and make informed decisions,
Not Personalized; requiring users to find or select their domain
Domain-specific; requiring users to access and stitch together insights from many tools to gain awareness
Raw data-focused; requiring users to repeatedly analyze for insights
Slow; leaving users frustrated

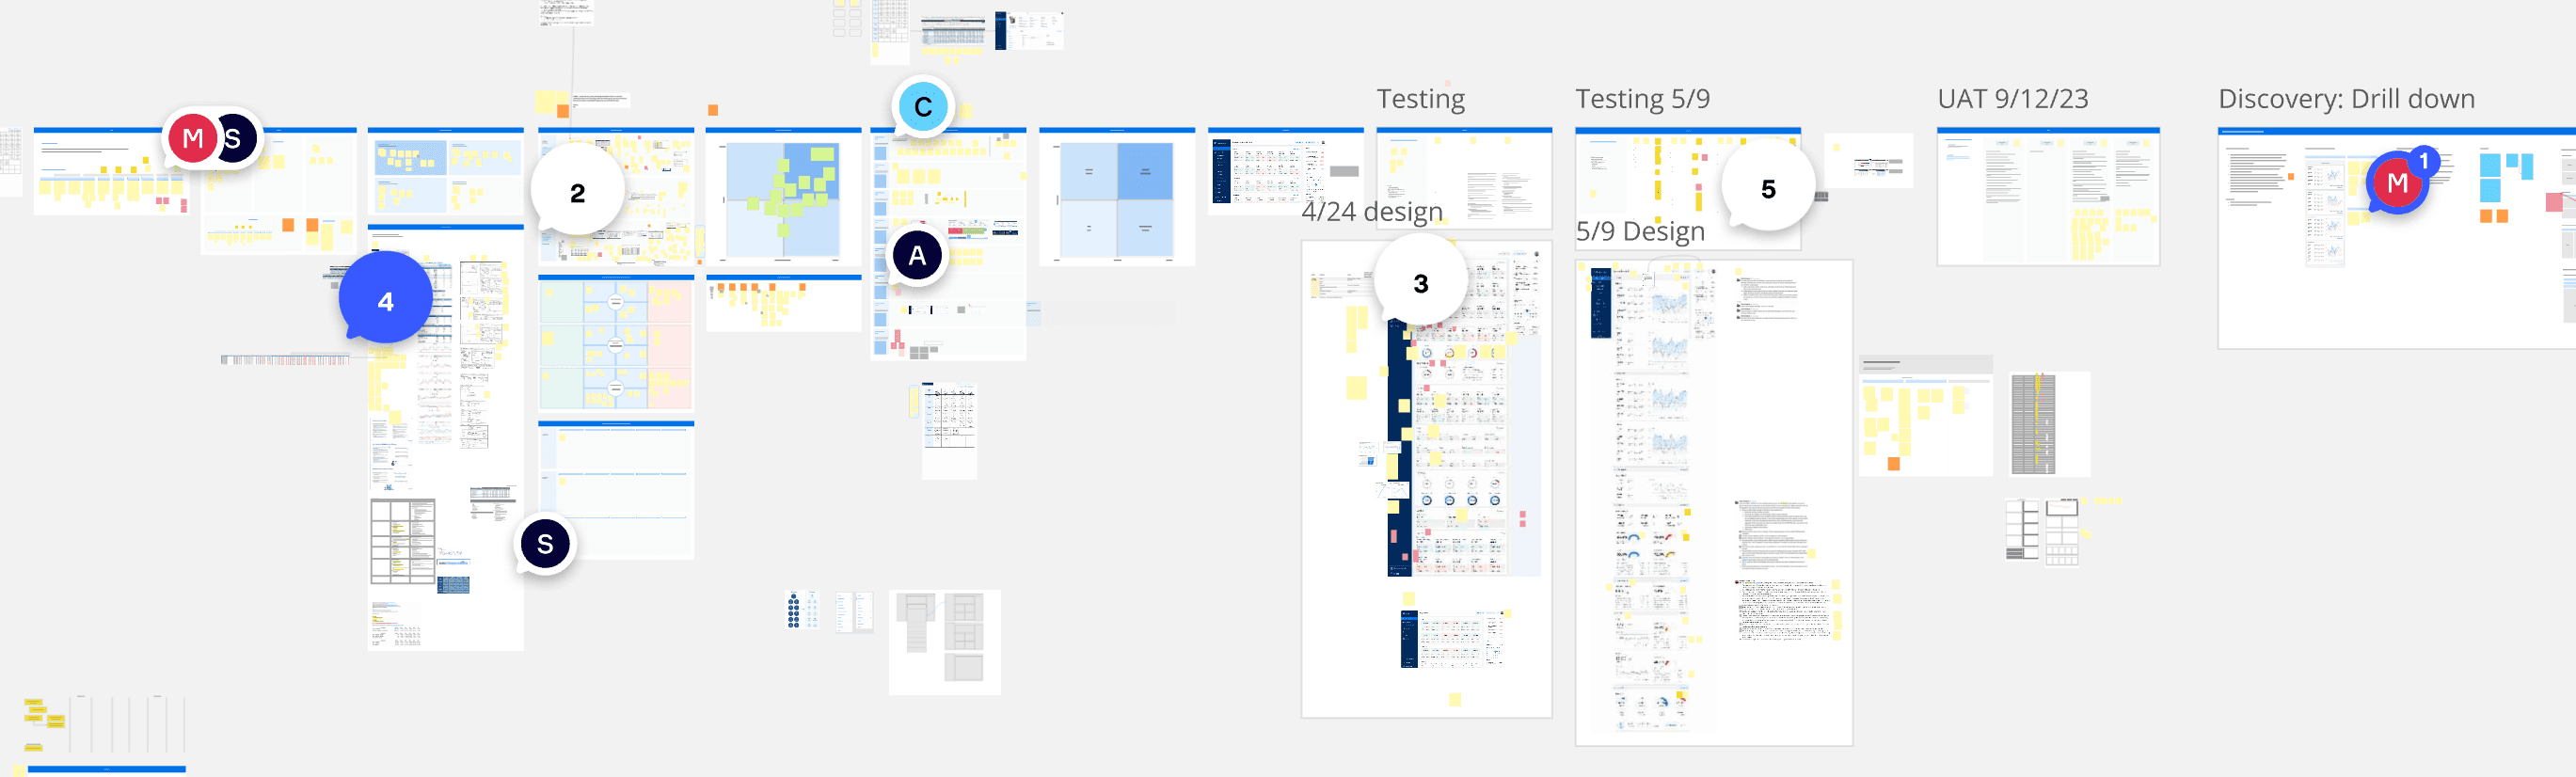
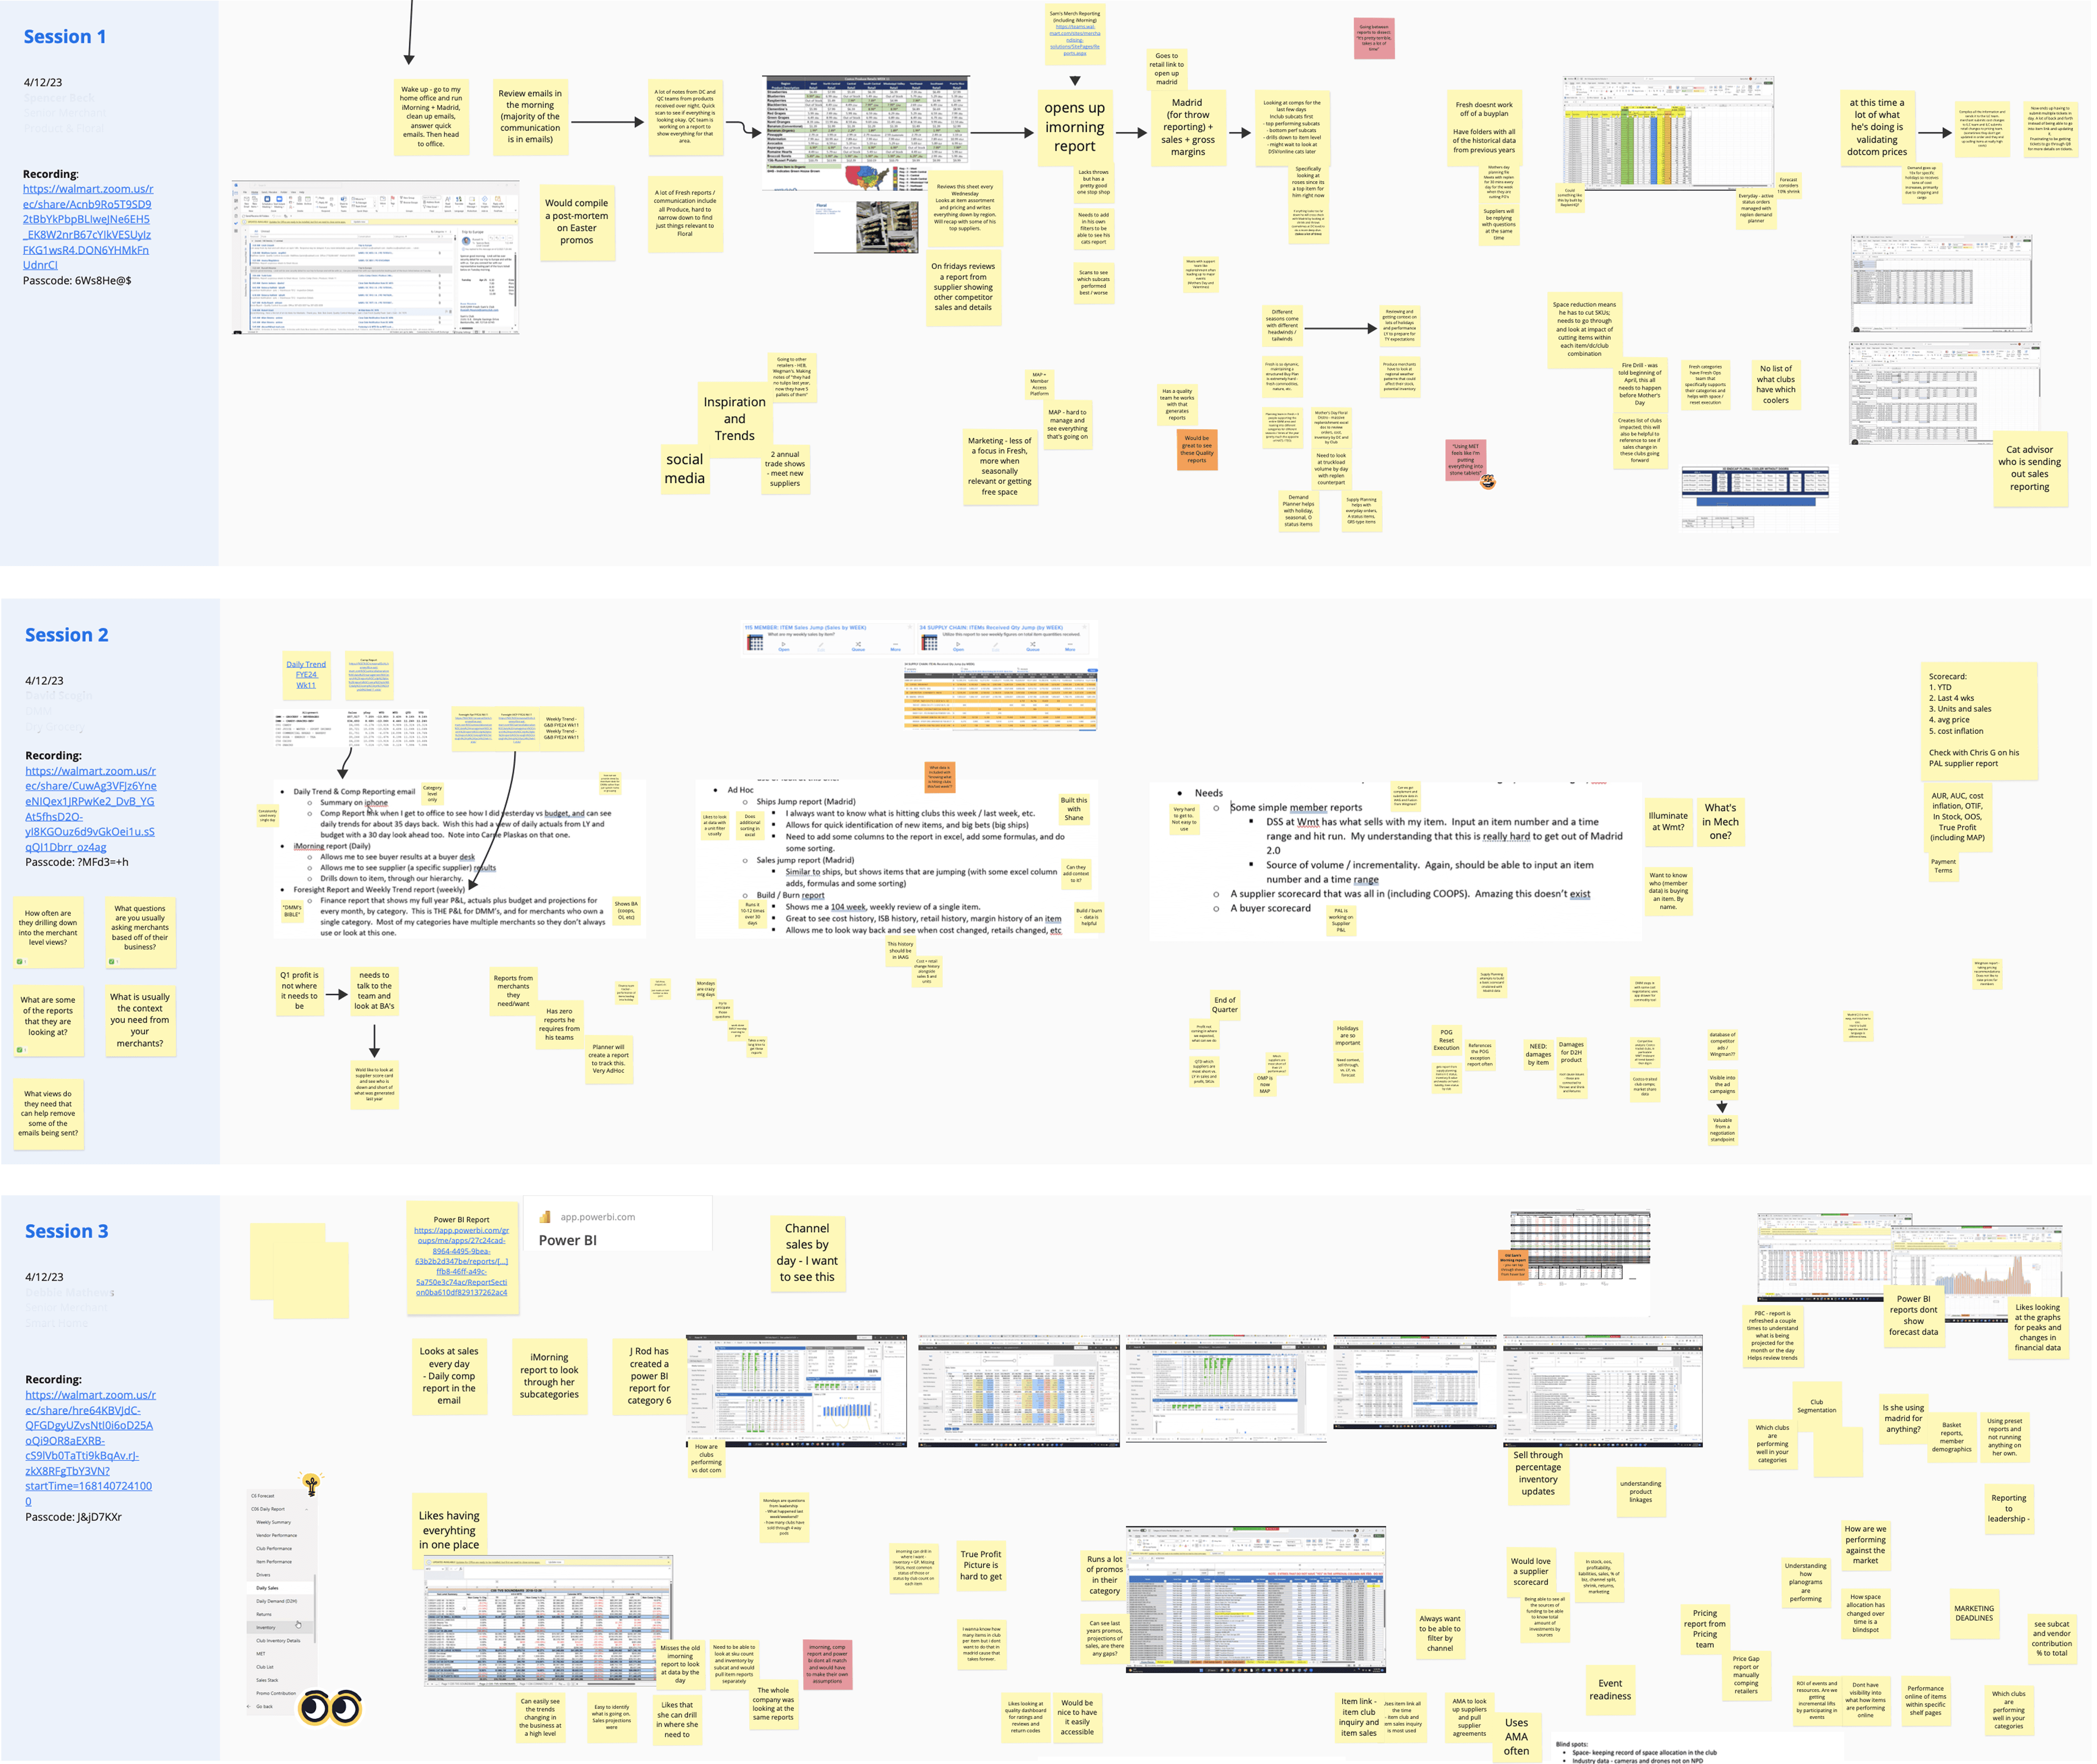
This was a high-priority request with an accelerated timeline—completed in just 1.5 sprints from conceptualization to handoff. The process included user research, stakeholder interviews, rapid prototyping, and iterative testing to ensure an optimal user experience.

Due to the fast-paced timeline, research and user interviews were conducted in parallel. We gathered extensive feedback and continuously refined our approach to prioritize key insights and improve usability.


Designs were rapidly iterated based on real-time feedback, refining information hierarchy, data visualization, and dashboard usability.
Each design was presented to 4-5 merchants from different departments to pressure test if all the data is applicable to all users. This helped us continuously iterate on designs and fill in the gaps around data and usability.
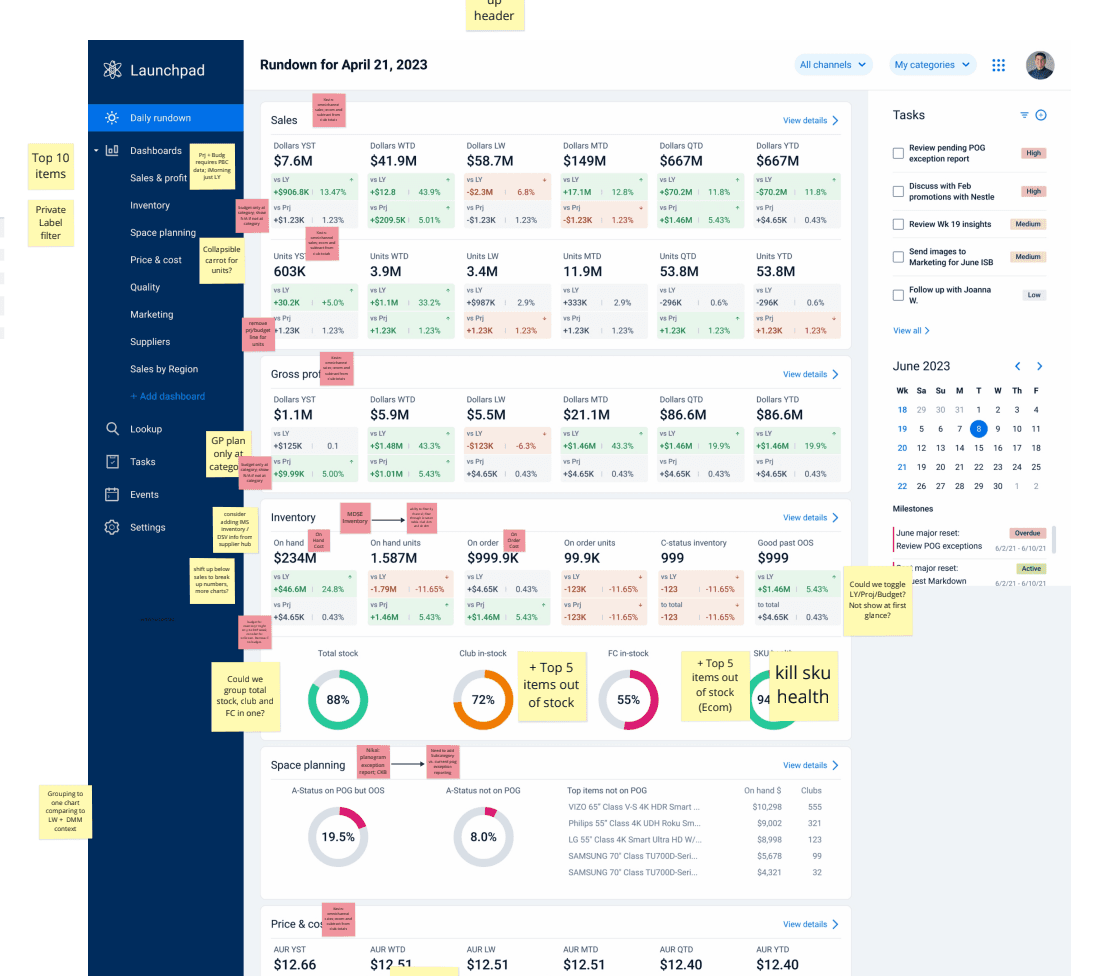
The current dashboard experience provides users with prioritized and consolidated data to be able to review at a high level but also dive deeper by applying specific timeframes and filters to their data.
Business Goals Achieved:
Adoption; Goal of 50% adoption (~150 merchants) by end of the fiscal year
Engagement; as value is inferred with organic, frequent, repeat usage
Trust; to not create an additional source of truth, align each metric with Data Governance teams

©2025 by Namitha Karupakula.